
November 20, 2026

Plot coding AI models from Anthropic, OpenAI, and Google on a single chart by Terminal-Bench score and cost per task to guide your selection.
Product facts
- Type
- Web App / SaaS
- Category
- AI & Machine Learning › Evaluation & Observability
- Pricing
- Free
- Launched
- Nov 20, 2026
- Listed
- Nov 20, 2026
- Website
- aicharts.io
Overview
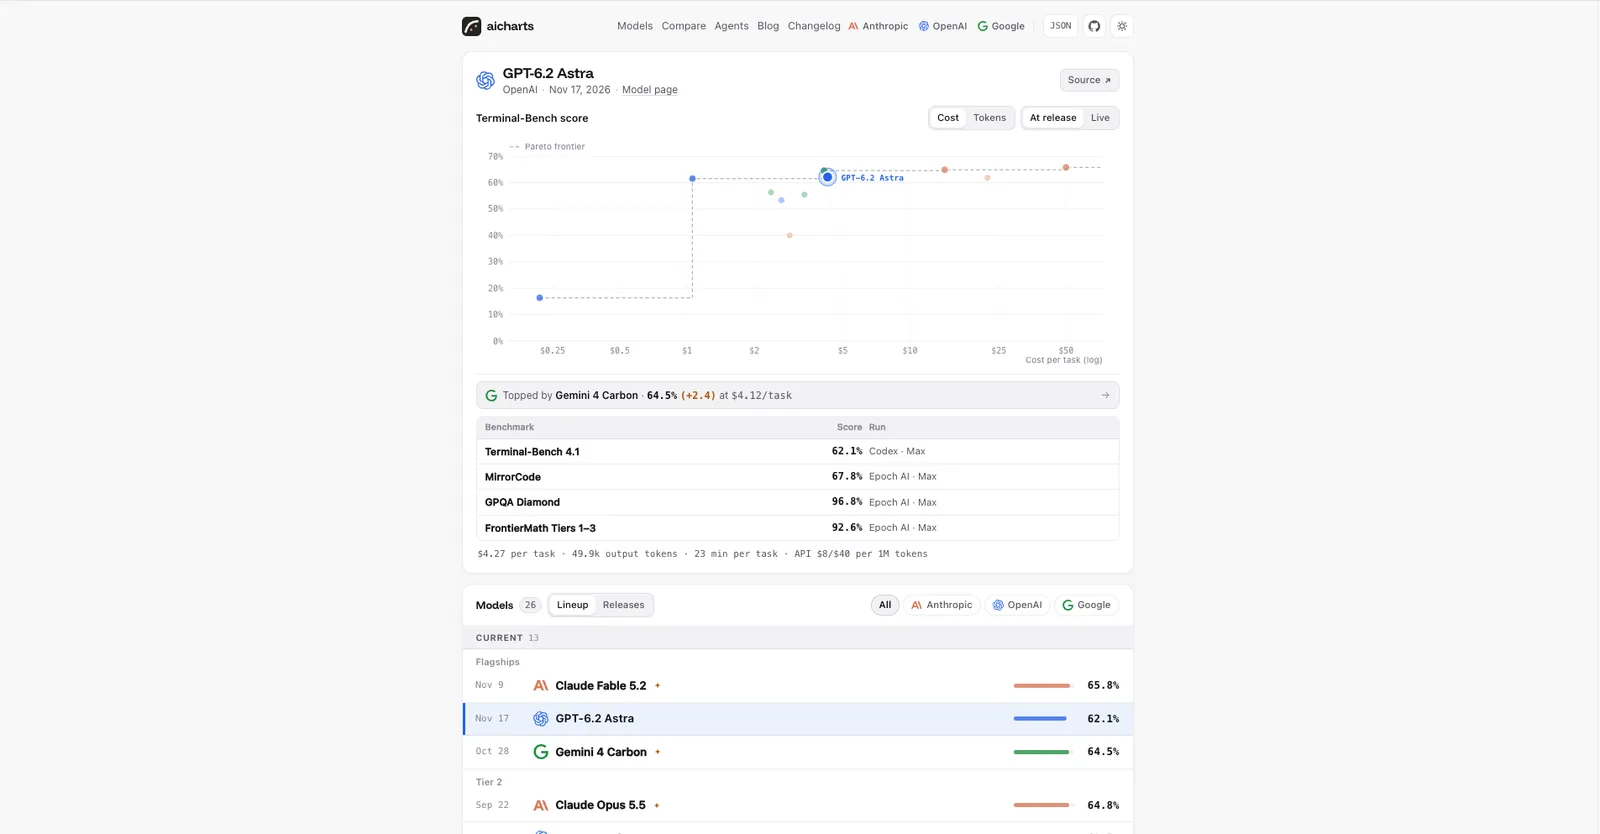
aicharts is a web app for visually comparing the performance and cost of different AI models on coding tasks. It places models released by Anthropic, OpenAI, and Google on a single chart, with cost per task on the X-axis and Terminal-Bench benchmark scores on the Y-axis, helping you find the right coding model within your budget.
Key Capabilities
- Chart comparison: A scatter plot shows each model's Terminal-Bench score against its USD cost per task, making price-performance trade-offs easy to see.
- Multiple benchmarks: Beyond Terminal-Bench, it also provides scores for MirrorCode, GPQA Diamond, FrontierMath Tiers 1–3, and more.
- Cost breakdowns: Displays token usage per task (e.g., output tokens), average duration, and API pricing (input/output prices per million tokens).
- Tiered model browsing: Groups models into Flagships, Tier 2, Tier 3, and Smallest, and distinguishes between Current and Superseded status.
- Transparent data sources: Data is sourced from the Terminal-Bench leaderboard (Apache-2.0), Epoch AI (CC-BY-4.0), and LiteLLM model prices (MIT).
Who It's For
Developers or teams evaluating multiple AI coding models, especially when balancing cost and performance. With aicharts, you can compare everything on one chart without manually gathering pricing and benchmark data from each provider.
Key features
- Score vs. Cost Chart: Plots Terminal-Bench scores against cost per task on a single chart for intuitive comparison.
- Multi-Vendor Coverage: Includes coding-related models from Anthropic, OpenAI, and Google.
- Multiple Benchmarks: Provides scores for Terminal-Bench, MirrorCode, GPQA Diamond, FrontierMath, and more.
- Token & Duration Details: Shows output tokens and average execution time per task.
- API Pricing Info: Lists input and output prices per million tokens.
- Model Tiers: Categorizes models into Flagships, Tier 2, Tier 3, and Smallest.
- Current vs. Historical Status: Distinguishes currently available models from superseded ones.
- Open Data Sources: Data comes from public sources under Apache-2.0, CC-BY-4.0, and MIT licenses.
Releases
Notify me Initial · aicharts
Q&A
- What are the data sources for aicharts?AI-generated
- Data comes from the Terminal-Bench leaderboard (Apache-2.0 license), Epoch AI (CC-BY-4.0 license), and LiteLLM model prices (MIT license).
- What do the X-axis and Y-axis of the chart represent?AI-generated
- The Y-axis shows the Terminal-Bench score and the X-axis shows the cost per task, illustrating the relationship between model performance and expense.
- Which vendors' models are supported?AI-generated
- It currently includes coding-related models from Anthropic, OpenAI, and Google.
- Are there benchmarks besides Terminal-Bench?AI-generated
- Yes. The page also displays scores for MirrorCode, GPQA Diamond, and FrontierMath Tiers 1–3.
Bookmark
This product has no owner yet
It was listed by the platform or its author left. If it is your work, prove your relationship to become the owner.
Claim this productAlternatives

The product content on this page was translated by AI from the author's original.